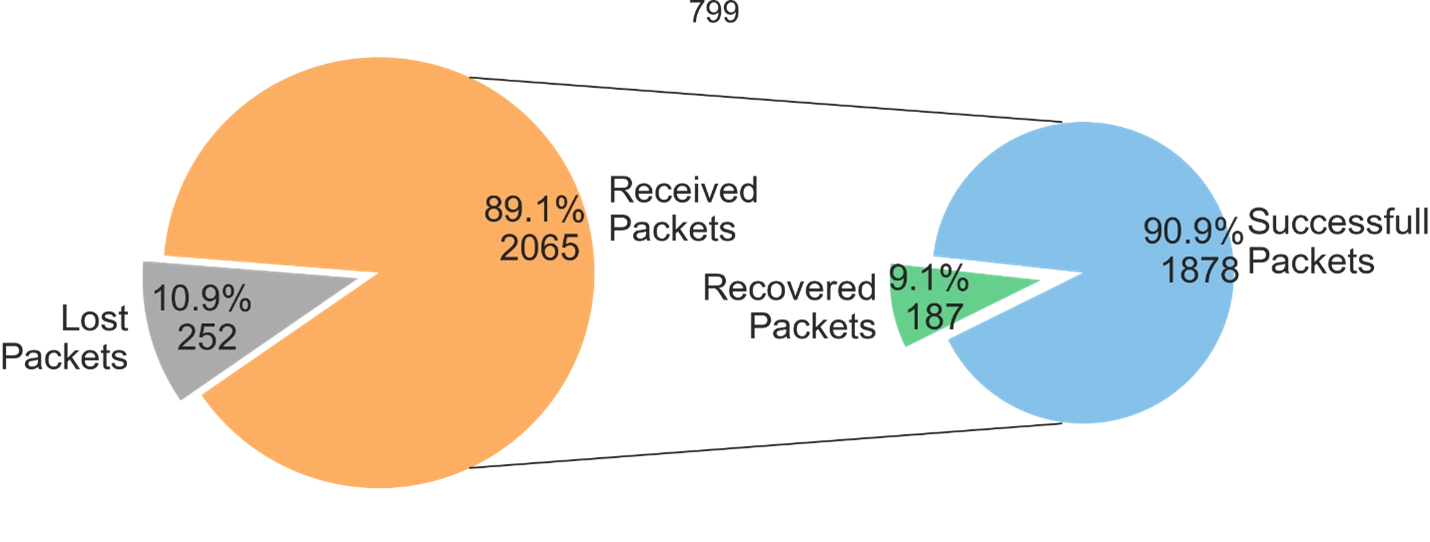
Figure 5- Pie charts representing communication success
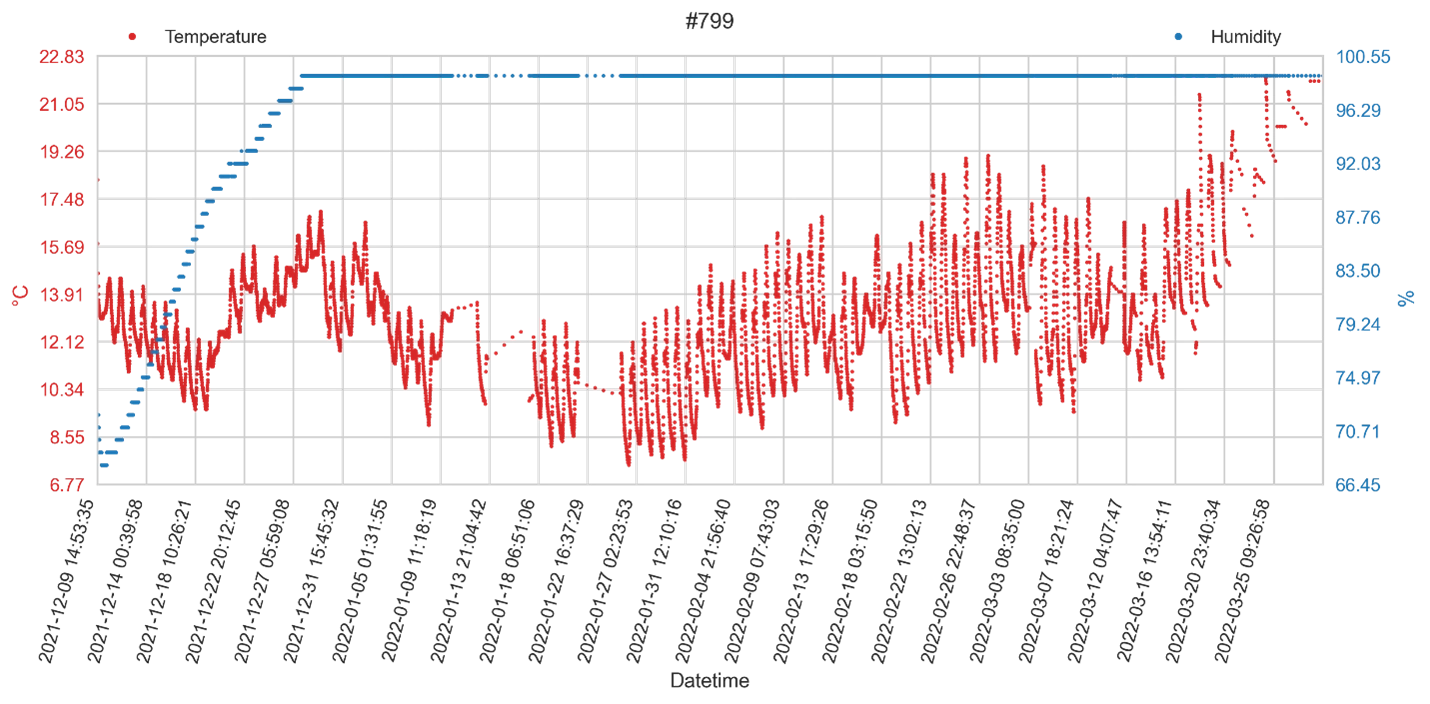
Being only a test of the base architecture, the main objective of the deployment was to find out the feasibility of communications and operating conditions (temperature and humidity). The following figures show the results in terms of transmission success rate and temporal plot of variables such as temperature and humidity. Based on these results it is possible to have confidence in the solution designed in terms of communications, and special care must be taken with the humidity conditions encountered. Regarding luminosity, its value remained at 0 throughout the deployment.

Figure 6- Time plot of temperature and humidity


