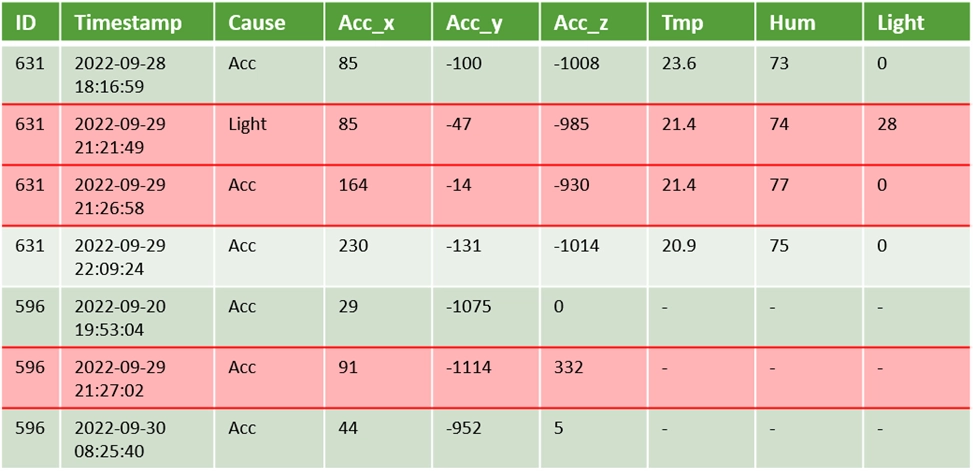
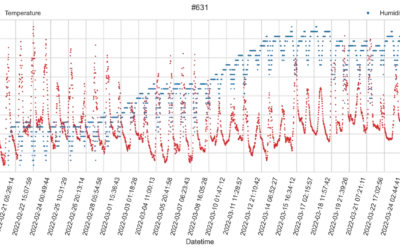
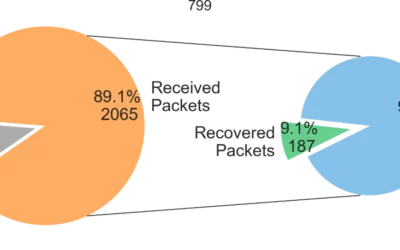
Being only a test of the base architecture, the main objectives of the deployment were to verify the viability of communications and operating conditions (temperature and humidity), as well as to detect intrusions to the site (through brightness and vibration). The following figures show the results in terms of transmission success rate and temporal plot of variables such as temperature and humidity. We also add a table with reported emergencies at the light level, at times when interventions have been made. Based on these results it is possible to have confidence in the designed solution in terms of communications and intrusion detection, at any time of the day. Similar to the first reported use case, humidity is also of concern.
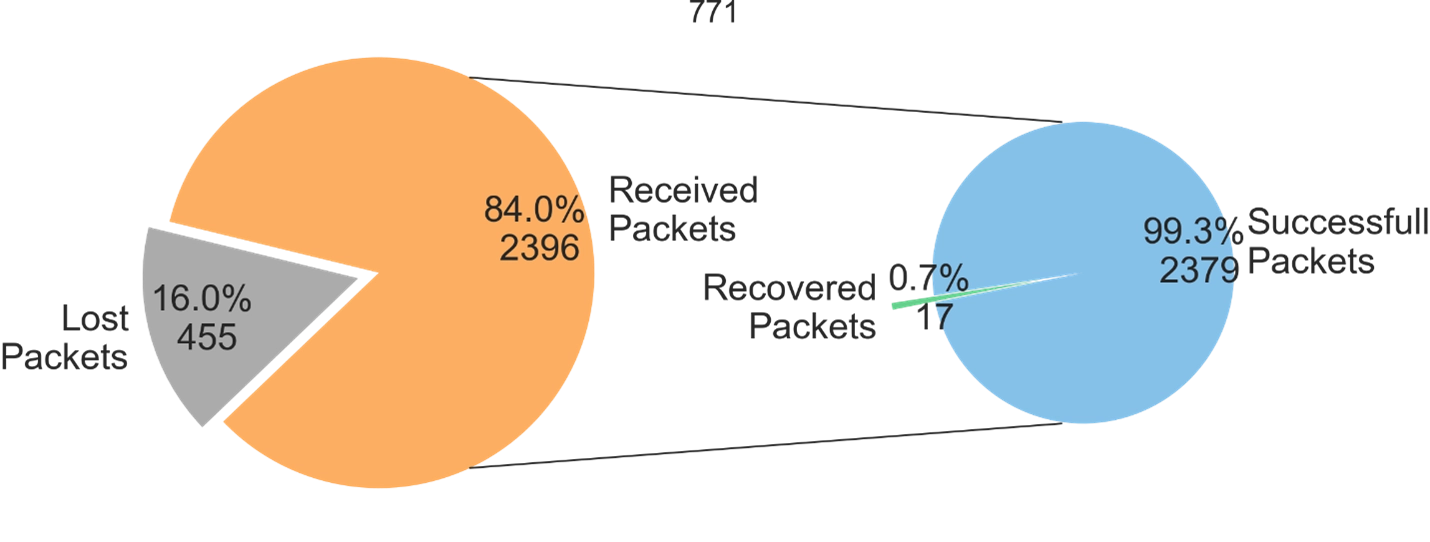
Figure 11- Pie charts representing communication success
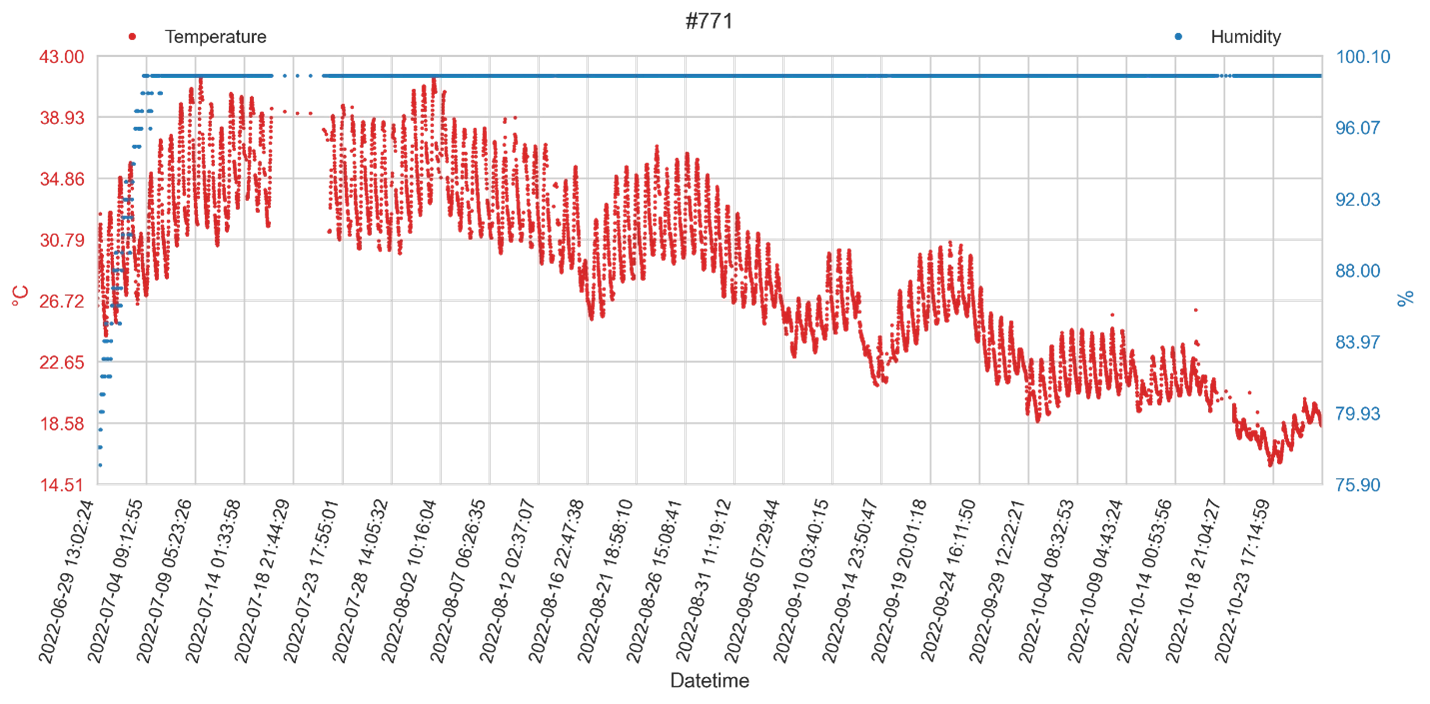
Figure 12- Time plot of temperature and humidity
Table Error! No text of specified style in document.–1 Emergency registration
